
Aptitude Trainer and Software Developer
Quiz Questions
Each question has four choices. More than one option can be correct. After you have finished the quiz scroll towards the last question to view your result. I have provided solutions and answers to all the questions.
| Correct Answers: | |
| Wrong Answers: | |
| Unattempted: |
Question 1
Out of the following diagrams which best explains the relation between: Male, Doctor, Professor.
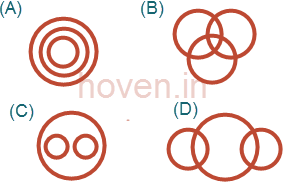
Ans: B
Found an error? Send us the ID of this question.
Question 2
Out of the following diagrams which best explains the relation between: Polio, Chickenpox, Diseases.
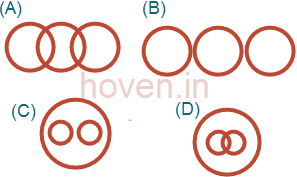
Ans: C
Found an error? Send us the ID of this question.
Question 3
Study the following diagram and choose the region that best represents the relation: Peons who are +2 but not government employees.
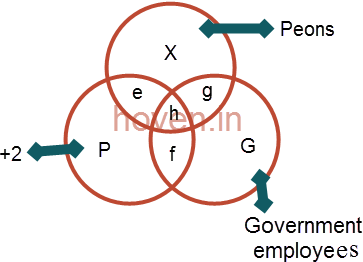
Ans: C
Found an error? Send us the ID of this question.
Question 4
In the given diagram the circle stands for "educated", square for "lazy", triangle for "urban" and the rectangle for "honest" people. Different regions in the diagram are numbered from 2 to 13. Study the diagram and choose the correct answer.
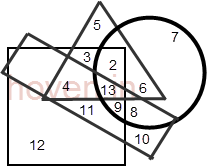
Lazy people who are educated, dishonest and urban are represented by
Ans: D
Found an error? Send us the ID of this question.
Question 5
In the diagram given below, rectangle represents men, triangle represents clerks and circle represents graduates. Which number represents men who are graduate and clerks ?
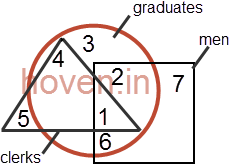
Ans: A
The region is common to all the three is 1.
Found an error? Send us the ID of this question.

This Blog Post/Article "Aptitude Questions on Venn Diagrams Set 8" by Parveen (Hoven) is licensed under a Creative Commons Attribution-NonCommercial-ShareAlike 4.0 International License.
Updated on 2020-02-07. Published on: 2016-02-08